DATA & TOOLS: What is your favorite biotech stock worth when it’s time for a Big Pharma license deal?
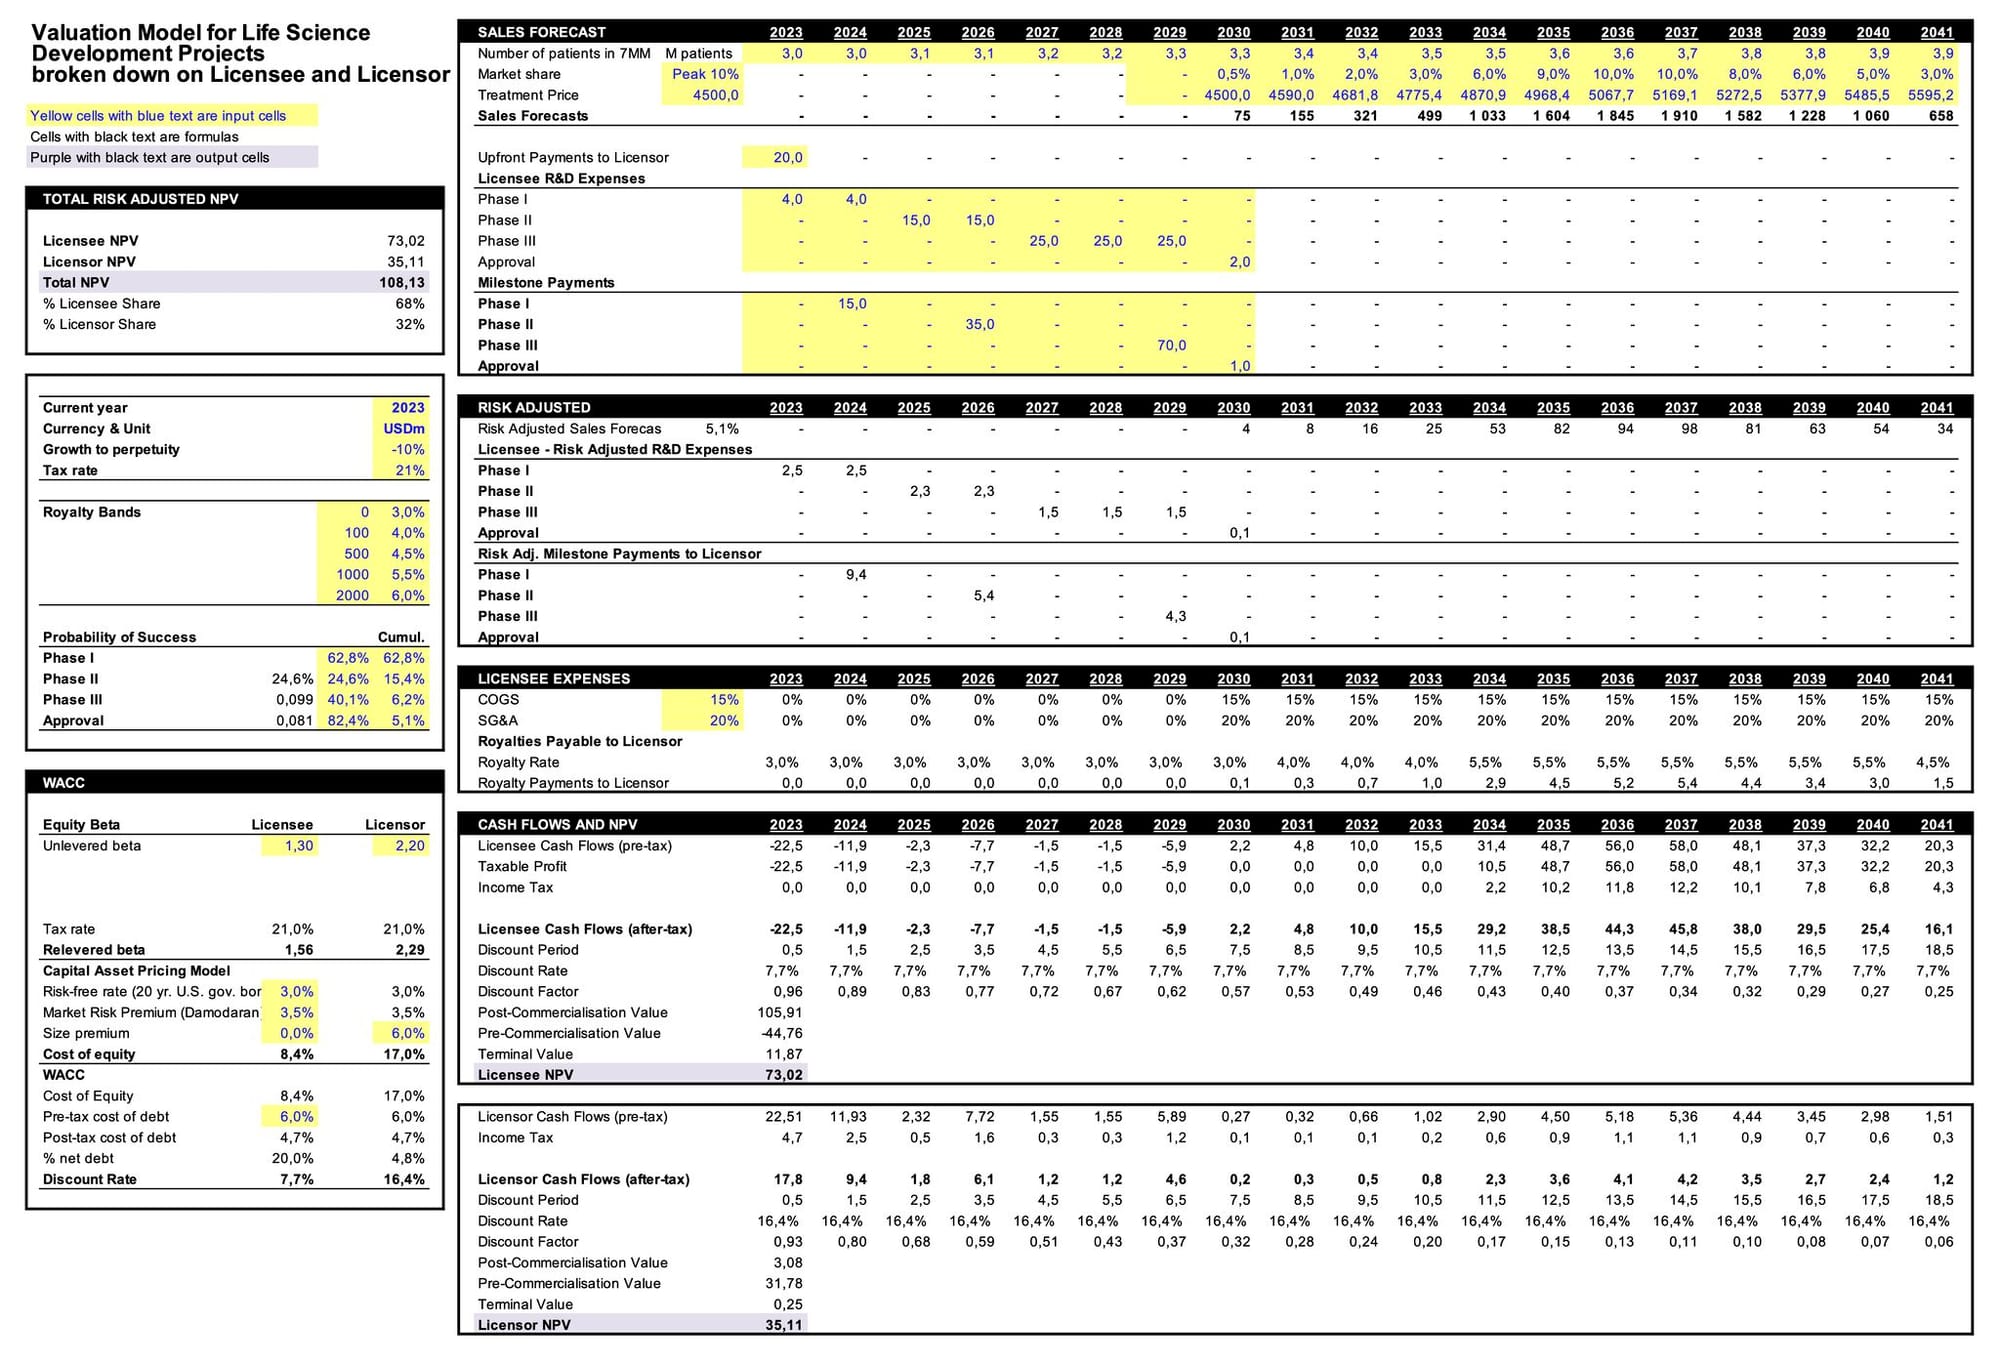
This biotech model generates risk-adjusted values broken down on both licensor and licensee. 💊💉🔬🧬🧪

💊 The template can easily be adapted to raw material exploration projects. Or any risk-adjusted project with heavy investments upfront and revenues far ahead in the future. Also, prints nicely to one horizontal A4.
💊 Most biotech R&D companies have no ambition to bring their projects all the way to the market. Instead they target to get through Phase I and II, to proof-of-concept and then get a license deal with a Big pharma company.
💊 With first revenues sometime 7-10 year into the future, it’s very difficult to value such assets. How do licensor and licensee come up with these sometimes astronomical sums in some license deal?
💊 A biotech license deal model must adjust for the varying stages of likelihood of success.
At the beginning of clinical development, there might be a 63% to get through Phase I and 25% chance for a successful Phase II. That means that the cumulative probability to get from beginning of Phase I to a successful Phase II is 63% x 25% = 16%.
On the flip side, after a successful Phase I there is a 100% probability that you will take the cost for Phase II but only a 25% probability that you will take the cost for Phase III.
The model needs to take these cumulative probabilities into account. Luckily, there are good statistics on recent success rates for various types of clinical development so you can get a pretty good idea. (link in the excel)
💊 Some key challenges in modeling include clinical development costs, time-frame and sales forecast profile.
Some features of this model include
- Top down sales forecast based on patients in the 7MM (seven major medical markets) with forecast built around estimated peak market share. But you can of course adjust to any other metric.
- Calculation for different discount rates for licensee and licensor
- Estimates for R&D expenses, COGS and SG&A (normally 15% and 20% of sales respectively, are good estimates for this)
- Upfront payment and risk adjusted milestone payments
- Tiered Royalty rates as a function of sales volume This produces one NPV for the licensor and one NPV the licensee.
💊 To gauge the size of the upfront, the milestones and the royalty in relation to the full value, you have to consider the risk profile in the project and structure in similar deals. Some hot niches get very high sums upfront, while other deals are more focused on compensating the licensor in milestone payments and through royalties.
Download model here in excel on link below.
Don't hesitate to hit me up if you have any questions about the model.


